


What Is Data Democratization? Why Is It Important for Institutions?
By wp-admin / August 18, 2021
...
Read More

Why is Real-Time Data Analytics Important in Decision-Making Processes?
By wp-admin / July 14, 2021
...
Read More
A More Comprehensive Data Analytics Experience with Geospatial Analysis Support
By wp-admin / June 16, 2021
...
Read More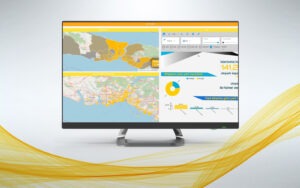
Why are Interactive Infographics Important for Business Intelligence Systems?
By wp-admin / June 9, 2021
...
Read More
From Traditional to Modern … False Facts About Transformation to the Modern Business Intelligence System
By wp-admin / May 28, 2021
...
Read More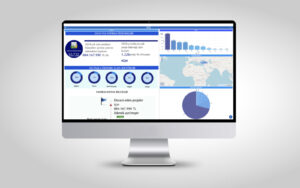
Self Service Business Intelligence: Discover the Advantages of The Most Modern Business Intelligence System
By wp-admin / April 27, 2021
...
Read More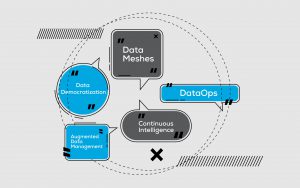
Data Science Trends We Will Frequently Encounter in 2021
By wp-admin / December 11, 2020
...
Read More

Why Is It Important to Create a Data-Driven Culture to Survive in The Digital Age?
By wp-admin / November 12, 2020
...
Read More