The insurance sector is a sector targeted by those who want to gain unfair profit. Insurance fraud constitutes 3.58% of all fraudulent activities.
Insurance fraud is classified as “hard” or “soft” depending on its scope. Incidents in the hard category often describe a situation where a fraudster deliberately planned damage, such as theft, fire, or even a fake death, to receive payment from the insurance company, and such cases are usually carried out by large organized groups. The second category is to present the damage higher in cases such as car accidents, theft, and fire to claim higher compensation. The second type of fraudulent activity occurs more frequently, but is less planned and is generally carried out by smaller groups.
Calculating the damages of insurance fraud may be too difficult, as it requires the investigation of a wide variety of high volumes of data. Since these types of fraudulent activities are usually carried out by small but organized groups, these people are likely to have been involved in more than one incident in the past. During graph data visualization, models that are incompatible with normal patterns are usually indicative of people who engage in suspicious behavior. Therefore, instead of searching a large number of databases, revealing all activities of suspicious people with graph visualization provides a faster solution to the problem.
Datactive reveals the connection between people and incidents by visualizing data from different sources on a single interface. Relationships detected between assets may indicate an organized crime.
Case Study:
We mentioned that fraudulent accidents are a very common fraudulent method. When there is an accident, if there is any suspicious situation or if the inquiry is determined as an institutional procedure for each incident, you can easily detect whether the accident is real or not by questioning the connections of the entities involved in the accident (person, vehicle, institutions, reports, etc.).
For example, we have an accident, and two vehicles have been involved in this accident. Let’s look at the result:
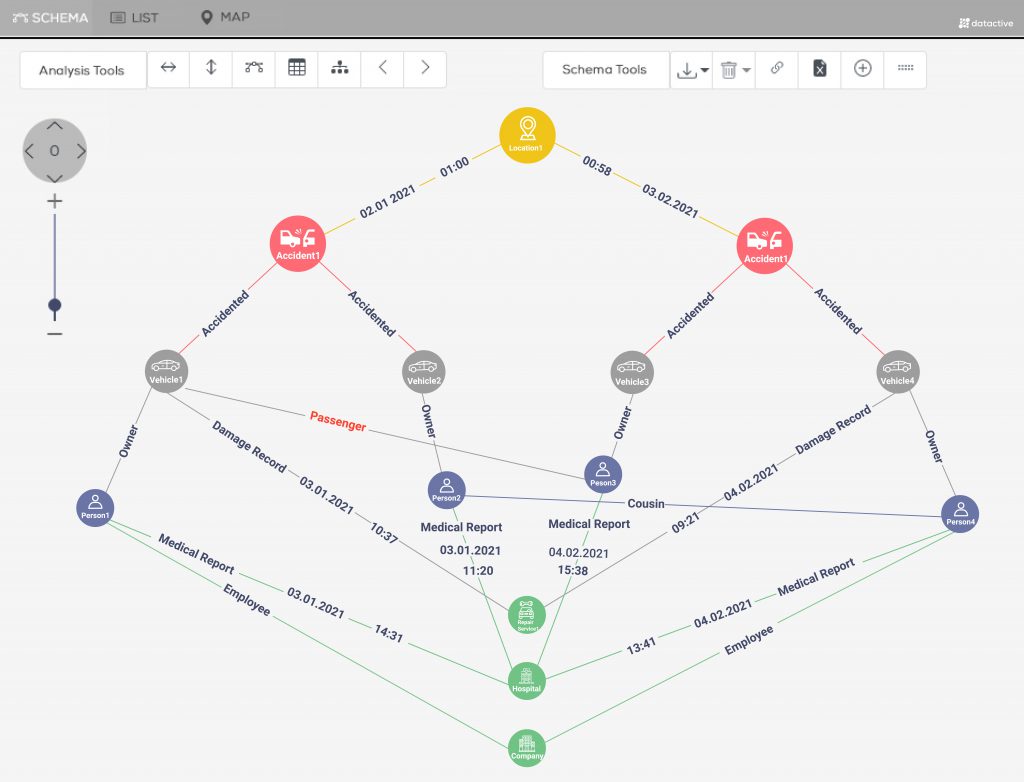
When we question the relationships through these vehicle owners; We see the information that the person who was involved in the accident as a passenger, had an accident record before (Person 3). Another person who involves in the second accident (Person 4), works at the same company as Person 1 who was involved in the first accident as an owner of the vehicle. They also receive damage reports from the same service. Moreover, Person 2 and Person 4 are cousins. Besides all these, both these two accidents occurred in the same location and during the hours when the traffic was not active, and all the passengers and vehicle owners received a medical reports from the same hospital.
As we can see in the case above, we were able to see the connections between two accidents at once, thanks to Datactive’s ability to visualize different data on a single interface. This network of relationships strengthens that these two accidents are probably fake. Therefore, with a single query, Datactive saves the insurance company from a serious loss in the long term.
By using Datactive actively as your institution’s usual inquiry procedures, you can detect such fraudulent behaviors quickly and save your money and time. For detailed information, please contact us.